ALLotaxonometry
Published at Jul 5, 2024
View live: allotaxp.vercel.app
Source: allotaxp
Allotaxonometry is a collection of datavisualization tools to compare two systems that have comparable (Zipfian) ranked lists of components. For instance, popularity of baby names at different in time (see Fig. 1), language use on Twitter, or forest tree species abundance. By juxtaposing pairs of heavy-tail Zipf distributions using rank-turbulence divergence, a tunable instrument improving on well known metrics such as the Jensen-Shannon divergence, allotaxonographs provide a flexible tools to visulize and quantify rank-rank histograms. See Dodds et al. 2020 for a deep, deep dive on allotaxonometry.
We built a a simple web interface in Svelte where user can just drop-in their datasets and obtain a publication ready visualization. This dashboard sits on top of allotaxonometer.js, a javascript package to calculate the different divergences.
The main plot looks as follow
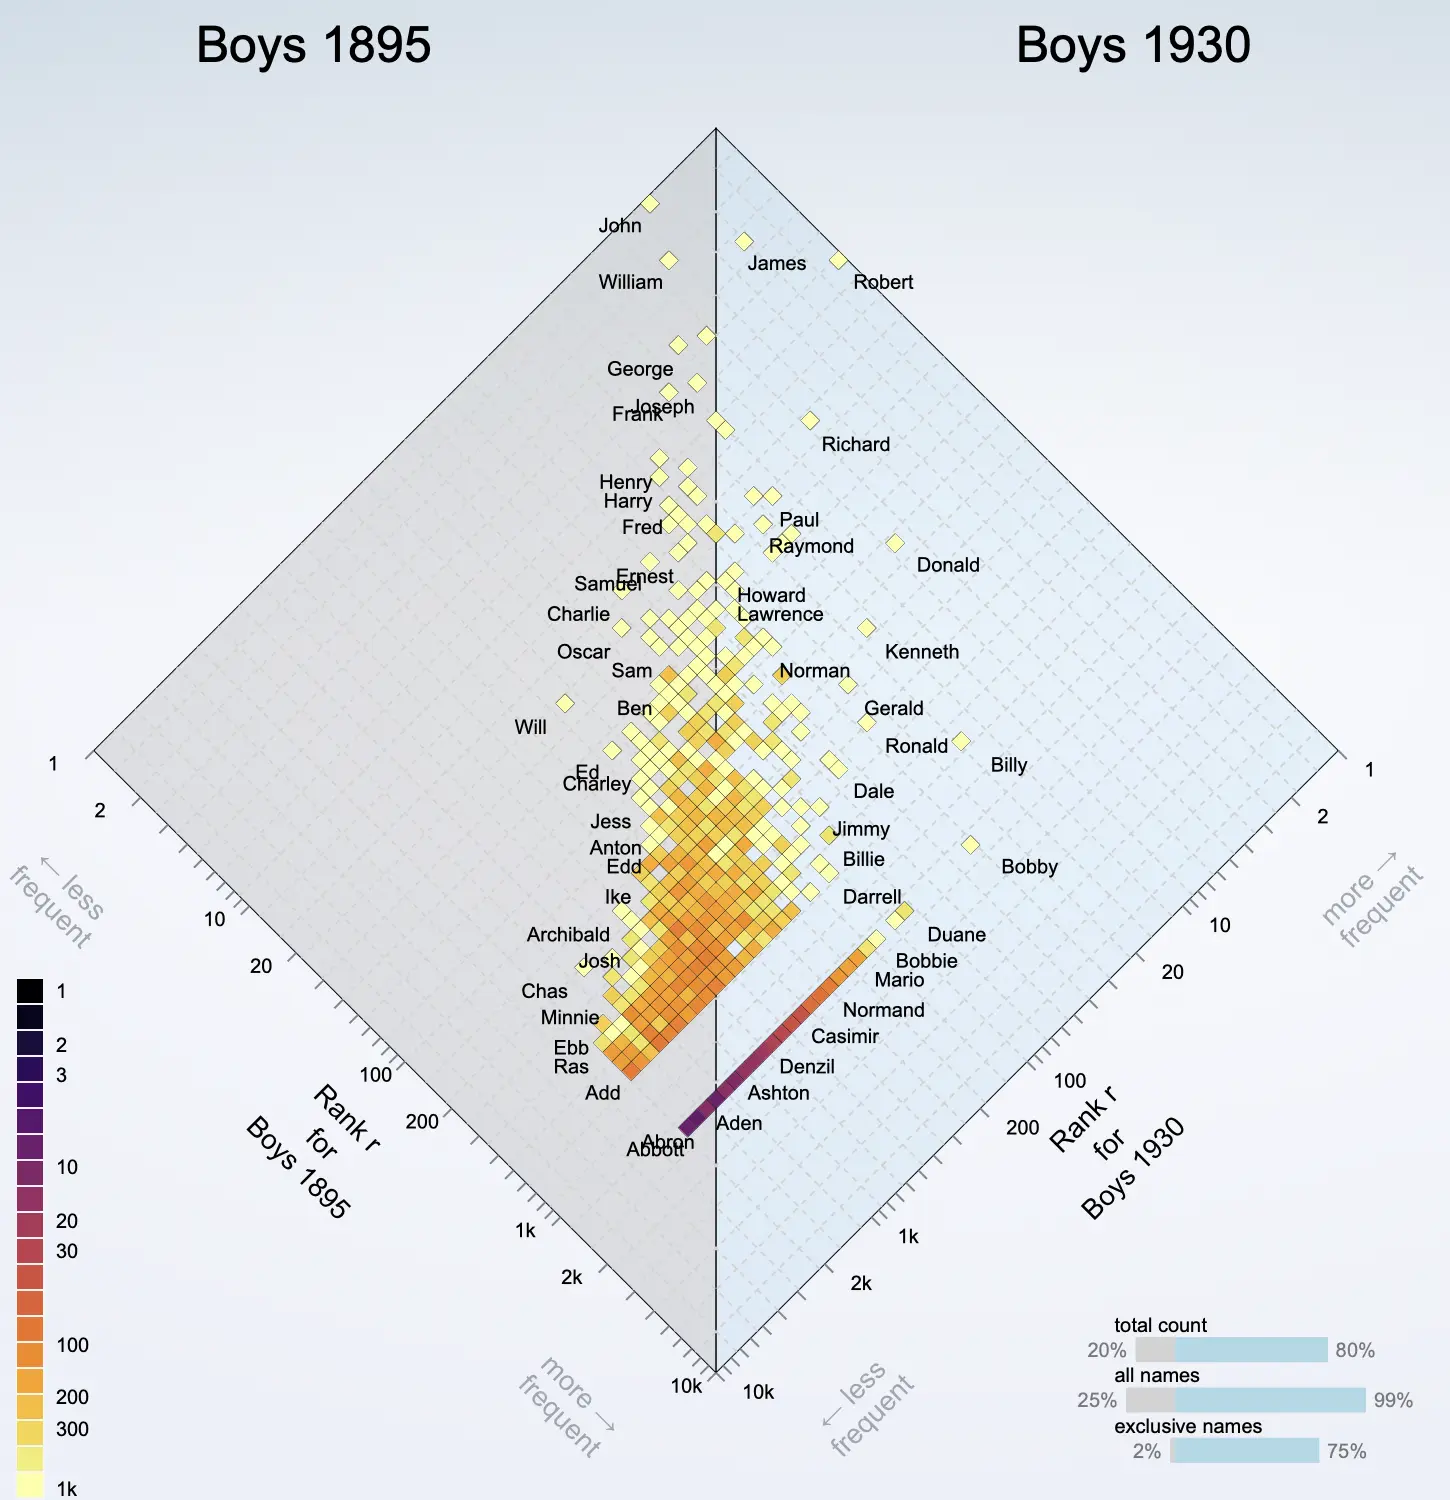
Allotaxonometry of popular US boy baby names in 1895 and 1930. When examining the most popular baby names in 18951945 and 1930 using Allotaxonometry, we observe significant growth in popularity for names like Robert and Donald. This is evident from their positions further to the right on the diamond plot, indicating their increasing popularity over time.